


Ranked: The 25 airports with the most low-cost flight connections

4 min read
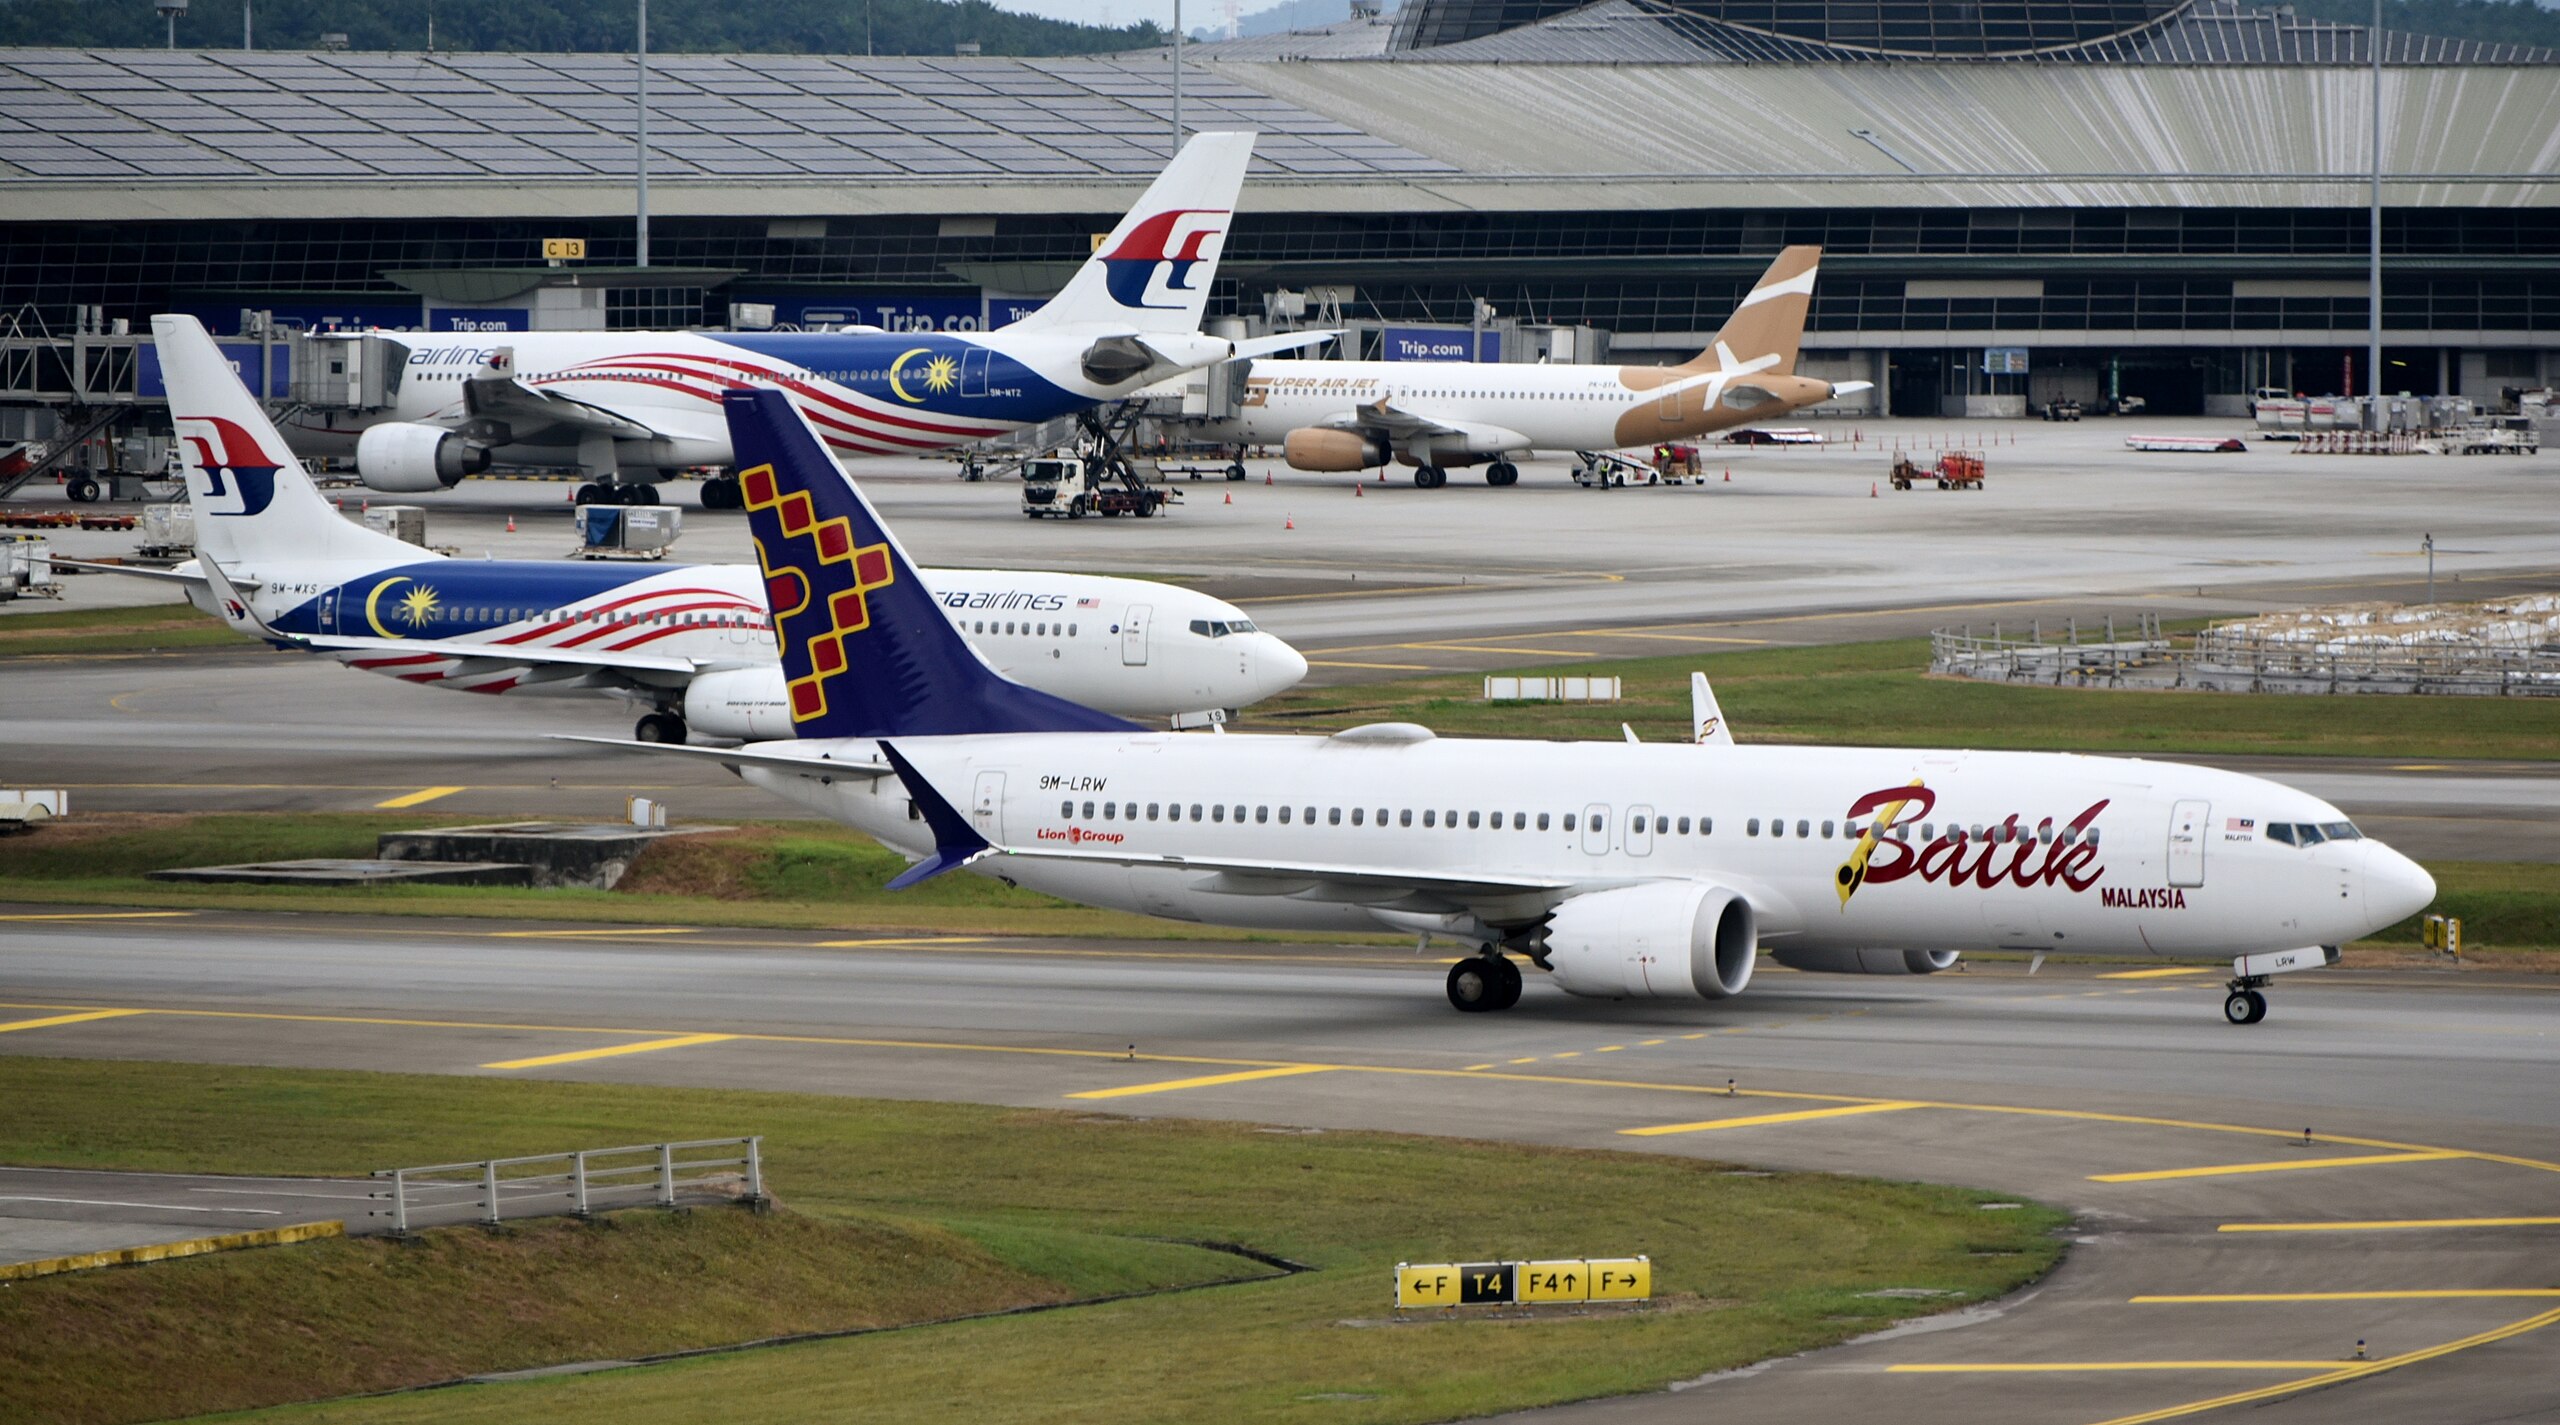
For travellers hoping to stretch their travel budget further, choosing the right airport can make a big difference.
The latest OAG Megahubs 2026 report identifies the world’s 25 best-connected airports for low-cost carrier flights, highlighting hubs where passengers have many possible connections using budget airlines.
Kuala Lumpur International Airport (KUL) takes the top spot for the second consecutive year, followed by Seoul Incheon (ICN). Istanbul Sabiha Gökçen (SAW) jumps four places to third. Barcelona (BCN) and Singapore Changi (SIN) complete the top five.
The ranking measures the breadth of low-cost connections available. For travellers, a strong low-cost hub can mean more low-cost airlines, offering more routes and possible itineraries to choose from.
Kuala Lumpur is the world’s top low-cost MegaHub
Kuala Lumpur offers almost 15,000 possible low-cost connections across 154 destinations, according to OAG.
AirAsia is its largest low-cost airline and operates 34% of flights at the airport. Low-cost carriers collectively account for 44% of KUL’s capacity.
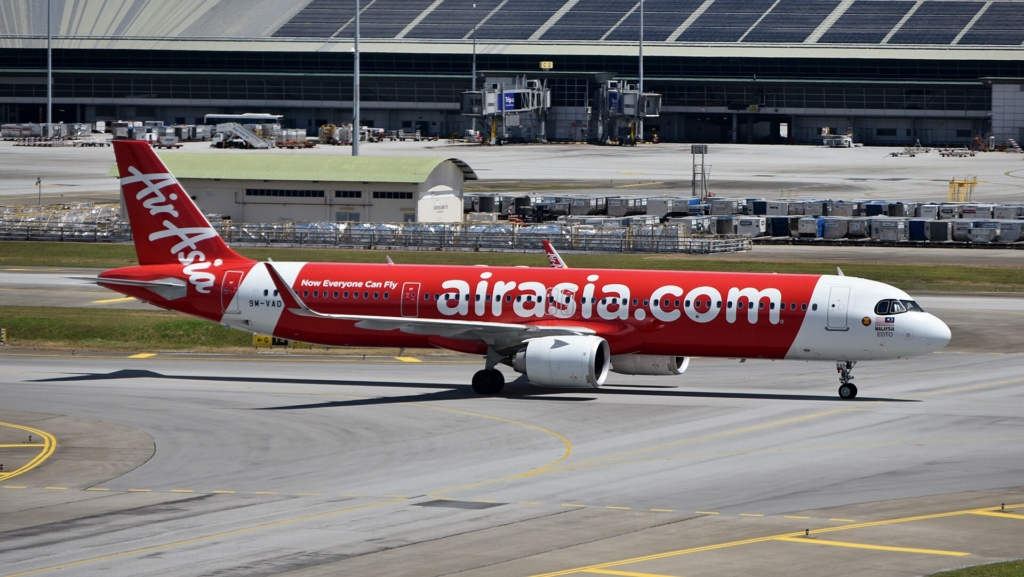
Kuala Lumpur also ranks fourth in OAG’s overall international MegaHub ranking, making it the most connected airport in Asia when both full-service and low-cost airlines are considered.
Seoul Incheon retains second place among low-cost hubs. OAG counted 17,727 potential LCC connections across 198 destinations, giving the airport a connectivity index of 89.5 compared with Kuala Lumpur’s 96.8.
Istanbul and Barcelona make big gains
Istanbul Sabiha Gökçen is one of the year’s biggest movers, climbing from seventh to third.
The airport has added 10 destinations, bringing its network to 162, while capacity has increased 10% year-on-year. Pegasus is its dominant low-cost carrier with a 61% share of flights. LCCs account for 64% of the airport’s capacity.

Barcelona climbs five places to fourth and is Europe’s highest-ranked low-cost MegaHub. Vueling dominates with a 40% share of flights. Competition is healthy, with low-cost carriers accounting for 72% of airport capacity—one of the highest proportions among the leading hubs.
Singapore Changi also rises five positions to fifth as both its destination network and number of potential low-cost connections increase.
The world’s 25 best-connected low-cost airports
OAG’s 2026 Low-Cost Carrier MegaHub ranking is:
| Rank | vs 2025 | Code | Airport | Country | LCC connections | Destinations | Index | Dominant LCC | Carrier share of flights | LCC capacity |
|---|---|---|---|---|---|---|---|---|---|---|
| 1 | — | KUL | Kuala Lumpur International Airport | Malaysia | 14,911 | 154 | 96.8 | AirAsia | 34% | 44% |
| 2 | — | ICN | Seoul Incheon International Airport | South Korea | 17,727 | 198 | 89.5 | Jeju Airlines | 10% | 38% |
| 3 | ▲ 4 | SAW | Istanbul Sabiha Gökçen | Türkiye | 13,132 | 162 | 81.1 | Pegasus Airlines | 61% | 64% |
| 4 | ▲ 5 | BCN | Barcelona | Spain | 17,458 | 247 | 70.7 | Vueling Airlines | 40% | 72% |
| 5 | ▲ 5 | SIN | Singapore Changi | Singapore | 11,316 | 167 | 67.8 | Scoot | 20% | 32% |
| 6 | ▼ 3 | MNL | Manila Ninoy Aquino International | Philippines | 6,580 | 98 | 67.1 | Cebu Pacific Air | 36% | 51% |
| 7 | NEW | CGK | Jakarta Soekarno-Hatta | Indonesia | 7,322 | 110 | 66.6 | Citilink | 14% | 45% |
| 8 | ▲ 5 | FUK | Fukuoka | Japan | 3,128 | 50 | 62.6 | Skymark Airlines | 7% | 35% |
| 9 | ▲ 2 | DEL | Delhi | India | 11,045 | 178 | 62.1 | IndiGo | 40% | 57% |
| 10 | ▼ 5 | DXB | Dubai International | UAE | 14,632 | 280 | 52.3 | flydubai | 29% | 38% |
| 11 | ▲ 3 | BOM | Mumbai Chhatrapati Shivaji Maharaj International | India | 6,866 | 138 | 49.8 | IndiGo | 43% | 60% |
| 12 | ▲ 3 | RUH | Riyadh King Khalid International | Saudi Arabia | 6,605 | 133 | 49.7 | flynas | 24% | 46% |
| 13 | ▼ 1 | JFK | New York JFK International | USA | 10,191 | 208 | 49.0 | JetBlue Airways | 26% | 27% |
| 14 | ▲ 2 | BKK | Bangkok Suvarnabhumi International | Thailand | 8,028 | 171 | 46.9 | Thai Vietjet Air | 10% | 26% |
| 15 | ▲ 2 | AMS | Amsterdam Schiphol | Netherlands | 12,745 | 281 | 45.4 | easyJet | 7% | 19% |
| 16 | NEW | FCO | Rome Fiumicino | Italy | 11,957 | 264 | 45.3 | Ryanair | 13% | 36% |
| 17 | ▲ 3 | DPS | Denpasar Bali Ngurah Rai International | Indonesia | 2,752 | 68 | 40.5 | Lion Air | 10% | 58% |
| 18 | ▲ 9 | LGW | London Gatwick | United Kingdom | 8,944 | 238 | 37.6 | easyJet | 48% | 68% |
| 19 | — | SGN | Ho Chi Minh City | Vietnam | 3,730 | 100 | 37.3 | Vietjet | 31% | 37% |
| 20 | ▲ 3 | PMI | Palma de Mallorca | Spain | 7,617 | 206 | 37.0 | Ryanair | 23% | 64% |
| 21 | ▼ 17 | HKG | Hong Kong International | Hong Kong | 5,790 | 164 | 35.3 | HK Express | 15% | 23% |
| 22 | ▲ 3 | HAN | Hanoi | Vietnam | 3,344 | 105 | 31.8 | Vietjet | 30% | 35% |
| 23 | ▼ 15 | NRT | Tokyo Narita International | Japan | 3,868 | 124 | 31.2 | Jetstar Japan | 13% | 47% |
| 24 | ▼ 18 | SYD | Sydney Kingsford Smith | Australia | 3,108 | 101 | 30.8 | Virgin Australia International | 21% | 40% |
| 25 | ▲ 4 | TPE | Taipei Taoyuan International | Taiwan | 3,280 | 109 | 30.1 | Tigerair Taiwan | 6% | 26% |
Source: OAG Megahubs 2026. Rankings measure potential low-cost carrier connections on 2 August 2026. LCC capacity refers to the share of total airport capacity operated by low-cost carriers.
Asia dominates low-cost connectivity
The list also shows how strongly the low-cost airline model has developed in Asia.
Sixteen of the 25 airports — 64% — are in Asia-Pacific. Eight are in Europe, the Middle East and Africa, while New York JFK is the only North American airport to make the list.
Southeast Asia is particularly important. Low-cost airlines provide 51% of all seats in the region, compared with a global average of 34%.

That helps explain why airports including Kuala Lumpur, Singapore, Manila, Jakarta, Bali, Ho Chi Minh City and Hanoi feature in the top 25.
Some striking movements appear further down the ranking. London Gatwick climbs nine places to 18th, while Fukuoka rises five places to eighth. By contrast, Hong Kong drops 17 positions to 21st, and Sydney falls 18 places to 24th.
What makes an airport a low-cost MegaHub?
OAG’s ranking is about connectivity rather than passenger numbers or fares.
For the main MegaHub index, OAG analysed the world’s 100 largest airports and 100 largest international airports. It calculated possible connections between arriving and departing flights within a six-hour window on 2 August 2026, the busiest day for global aviation during the 12 months to August.
It then compares those potential connections with the number of destinations an airport serves.
The Low-Cost Carrier International MegaHub Index uses the same methodology but restricts qualifying connections to low-cost flights.
An airport high on the MegaHubs list does not necessarily offer the world’s cheapest tickets. It offers a large network of possible journeys using low-cost carriers—potentially giving passengers more options when comparing fares for lower-cost international trips.
Sign up for our newsletter and get our latest content in your inbox.


More from

September 21, 20263 min read


September 17, 20265 min read


September 18, 20263 min read

