3.9 million hours lost to flight delays in 2025: These airlines were the worst

December 25, 2025
Ryanair recorded the highest proportion of flights affected by delays among major global airlines in 2025, according to new data from flight-tracking app Flighty.
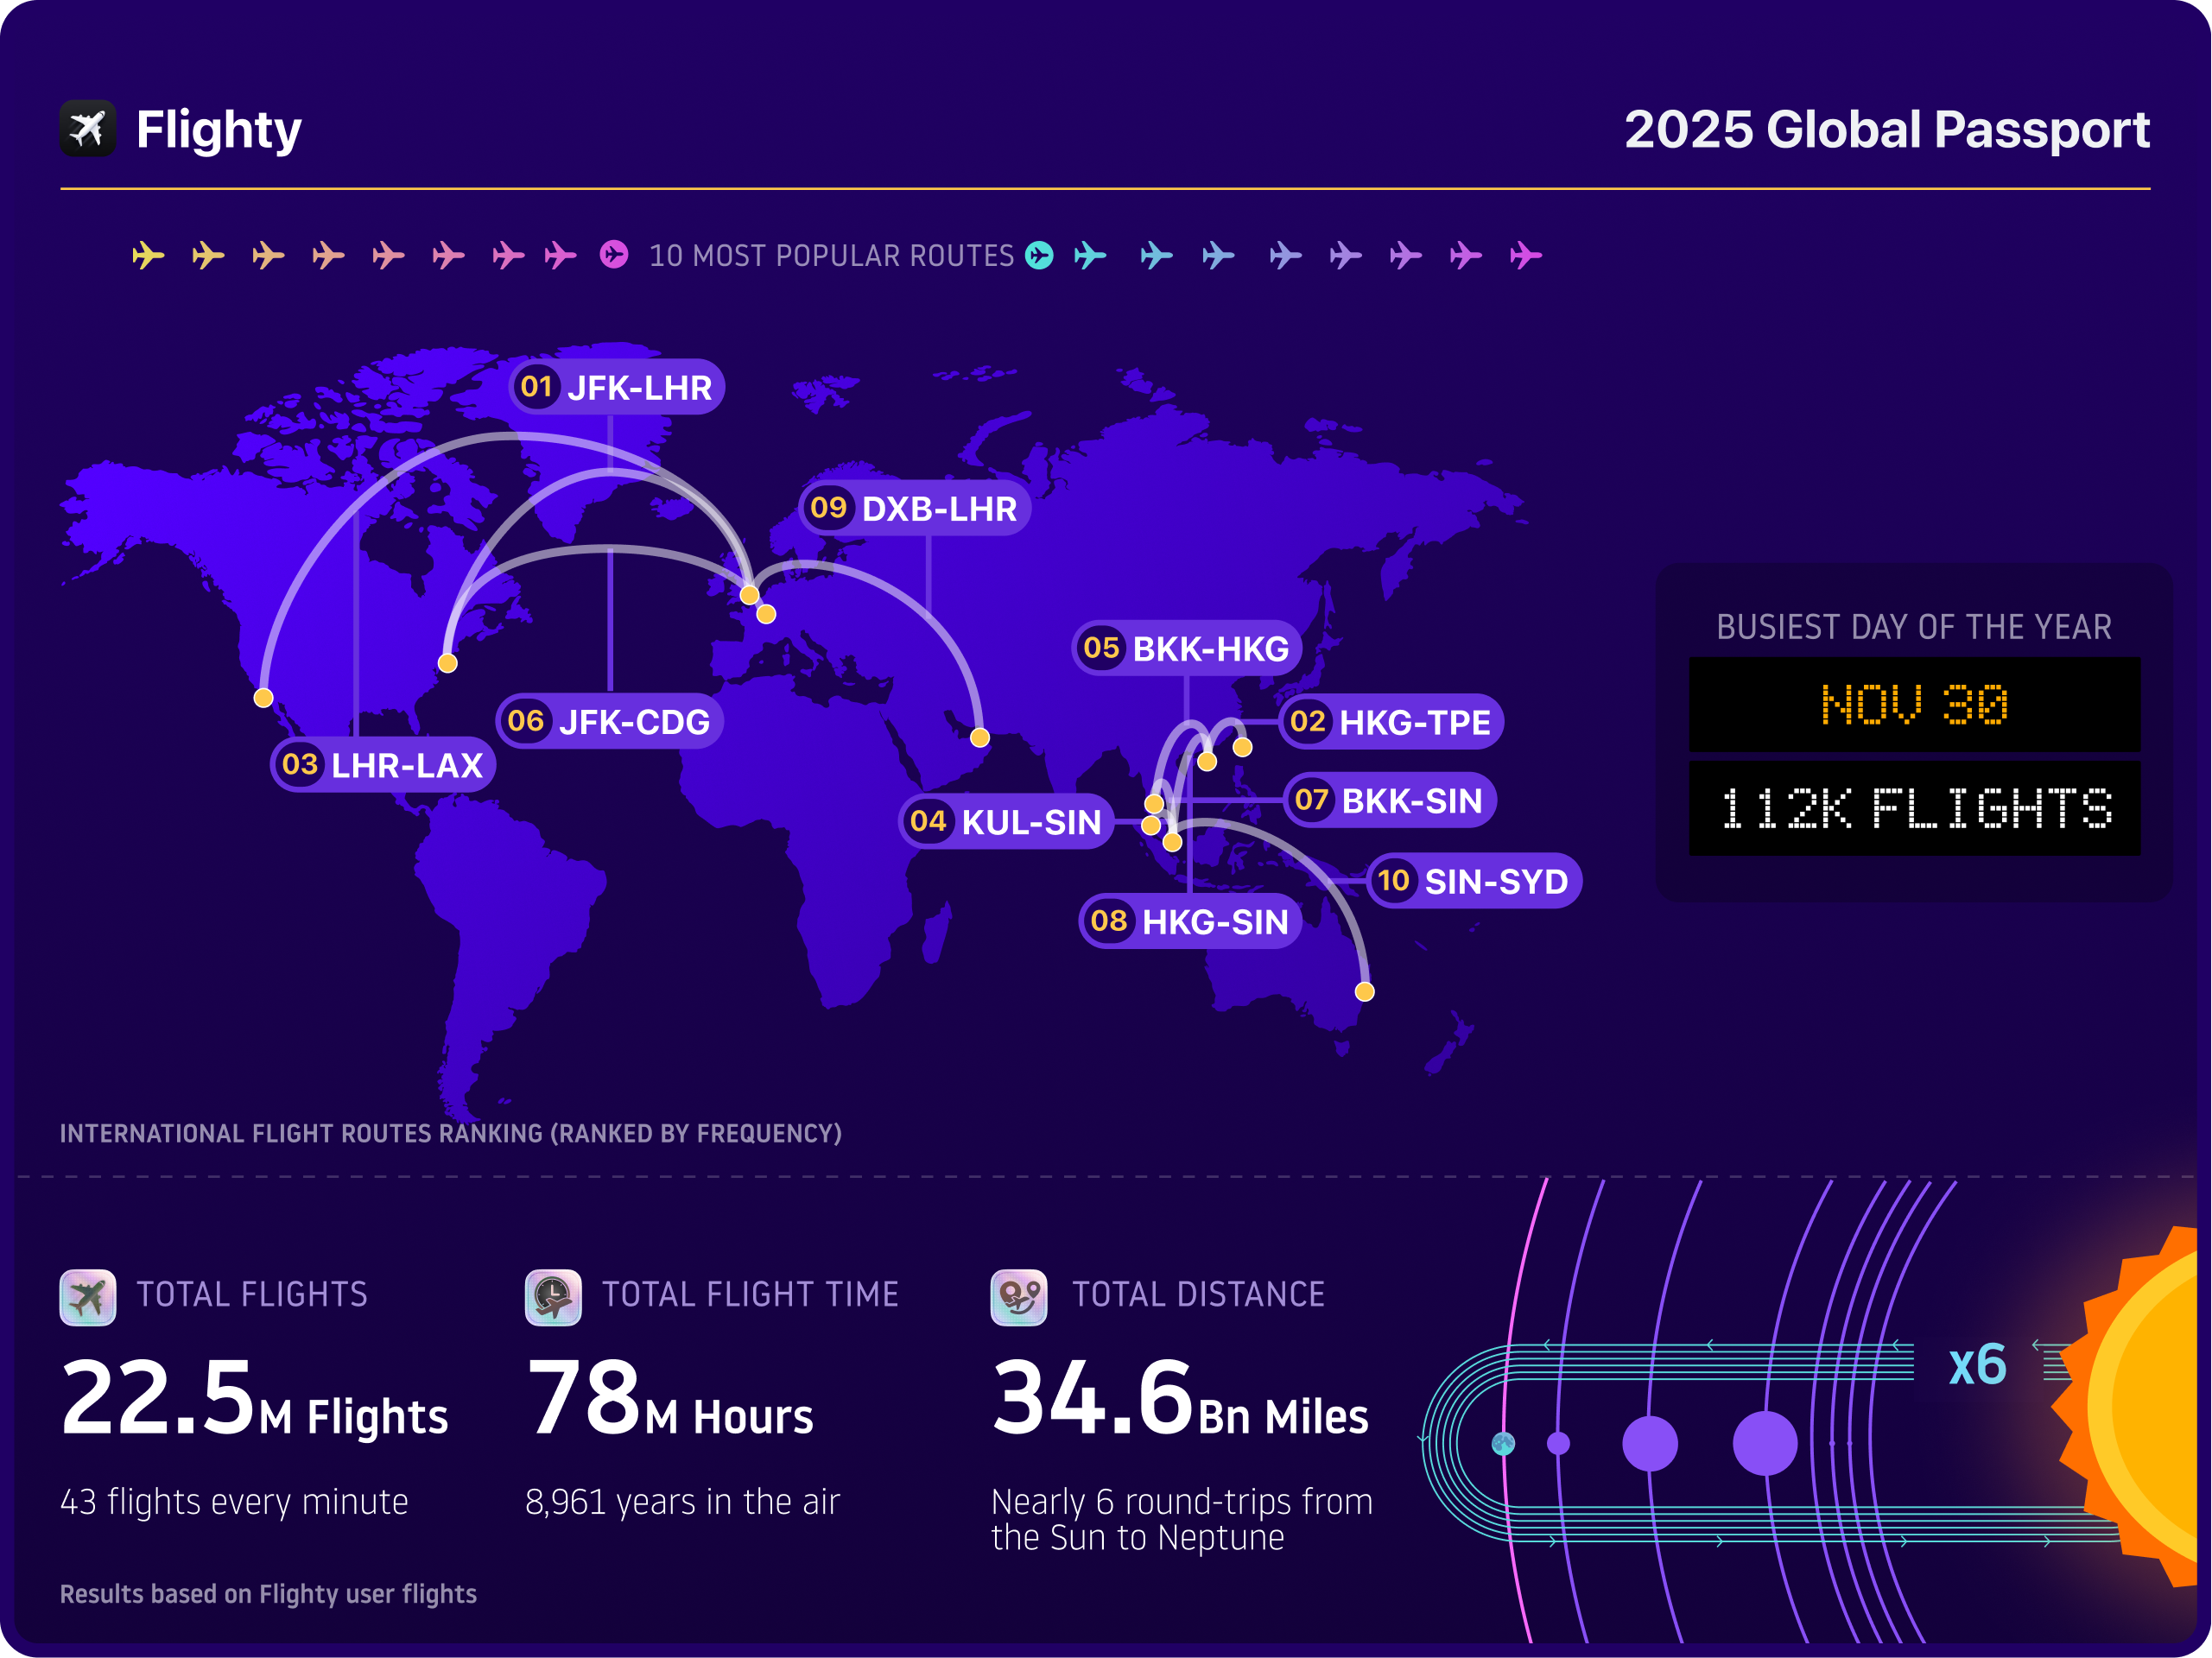
The company’s first Global Passport Report, published this week, draws on anonymised data from millions of journeys taken by its users during the year.
In total, those travellers flew more than 22 million commercial passenger flights, covering an estimated 34 billion miles and spending around 78 million hours in the air – the equivalent of almost 9,000 years of cumulative flight time.
2025’s most delayed airlines
While the scale of flying remains vast, the report underlines the persistence of operational disruption.
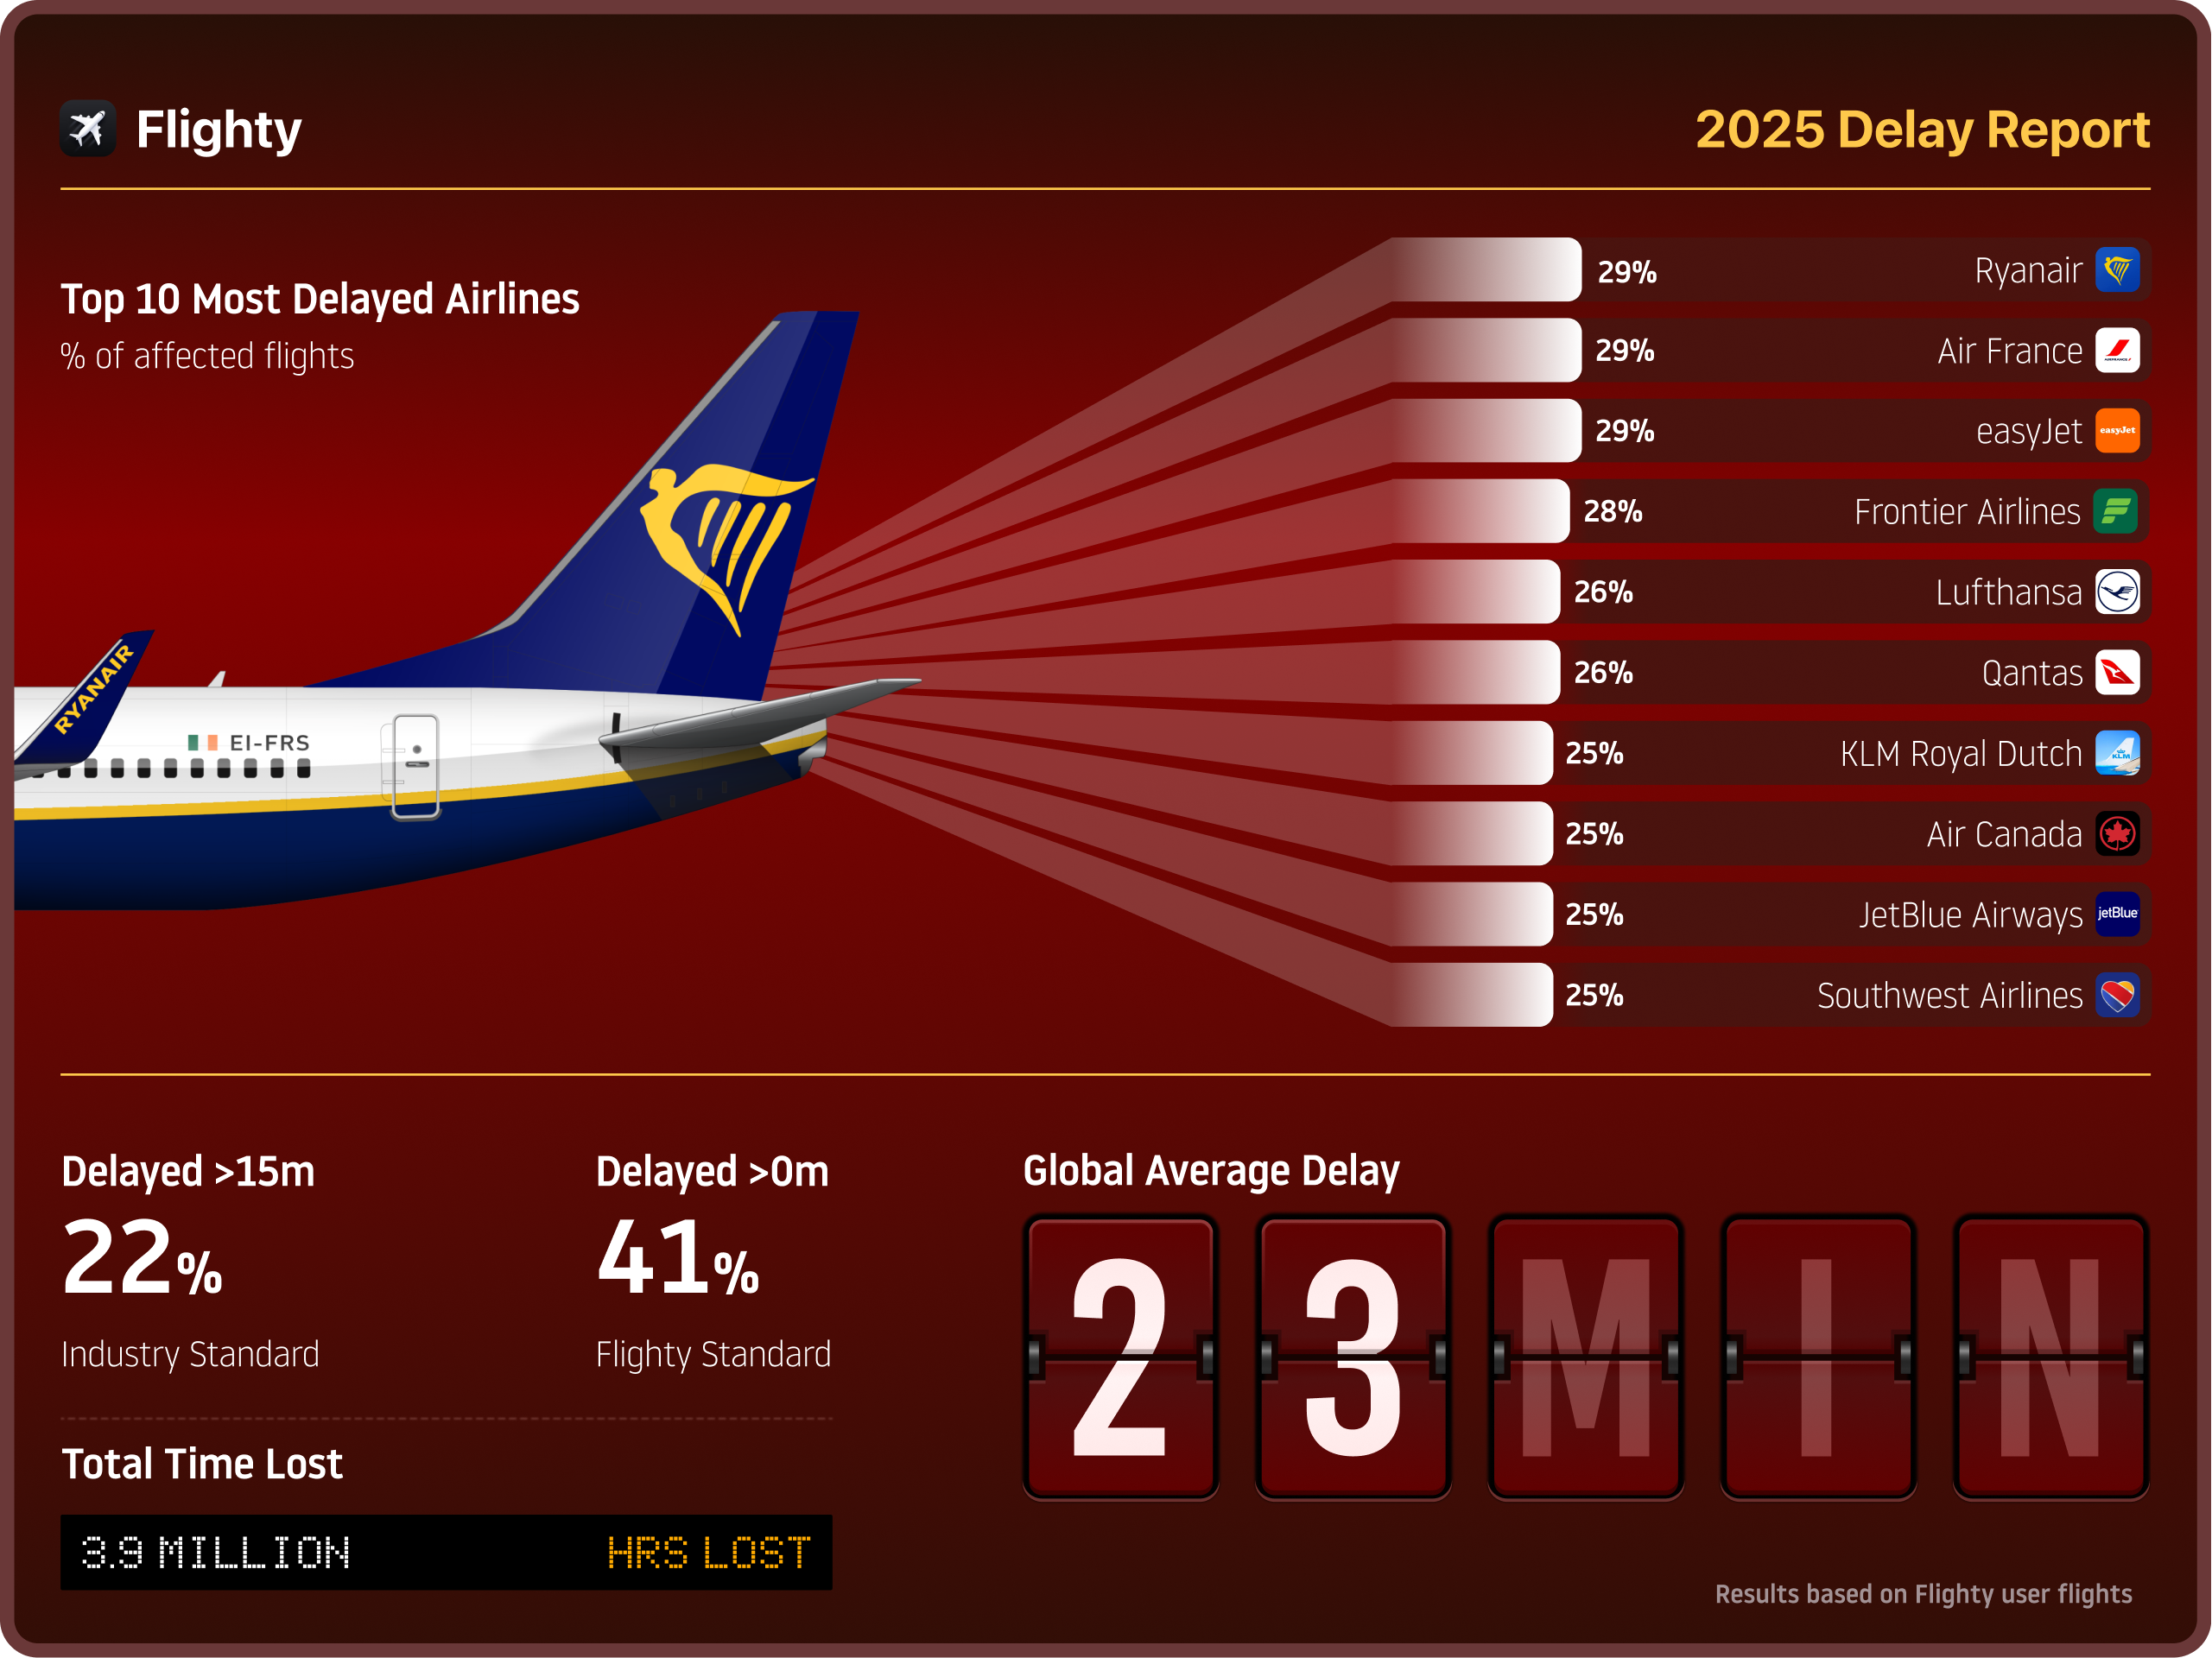
Flighty estimates that its users collectively lost 3.9 million hours arriving later than scheduled, based on flights reaching their destination more than 15 minutes behind schedule.
When assessed globally, Ryanair recorded the highest proportion of flights affected by delays among airlines captured in the dataset. The Irish low-cost carrier saw 29 per cent of flights flown by Flighty users impacted, placing it joint-top of the global rankings.
The report groups Ryanair alongside a small number of other carriers with similar performance, including Air France and easyJet.
Flighty noted that Ryanair’s position reflects both its extensive European network and the sheer volume of flights it operates.
The global top ten list also includes airlines from North America, Europe and Australia, underlining that disruption is not confined to any one region or business model.
Frontier Airlines followed closely behind, with 28 per cent of flights affected, while Lufthansa and Qantas each recorded 26 per cent. KLM, Air Canada, JetBlue and Southwest Airlines completed the list, all at around the 25 per cent mark.
In the United States, where Flighty has a particularly strong user base, Frontier Airlines emerged as the carrier with the highest proportion of affected flights, ahead of JetBlue, Southwest, American Airlines and Alaska Airlines.
A new metric: ‘Get Me Off This Plane’
Beyond conventional punctuality measures, the report also introduces a new metric aimed at capturing a less visible aspect of disruption: the time passengers spend waiting on board after landing.
Flighty’s “Get Me Off This Plane” metric tracks the gap between an aircraft’s scheduled arrival time and the moment passengers are actually able to disembark.
That interval can be extended by runway congestion, gate shortages, air traffic flow restrictions and holding patterns, particularly at busy airports.
While often excluded from standard delay statistics, Flighty argues these additional minutes have a material impact on the passenger experience, especially for those facing tight connections or long taxi times.

The Global Passport Report sits alongside Flighty’s annual year-in-review feature, which allows individual users to generate personalised summaries of their travel.
These include distance flown, time spent in the air, routes taken, aircraft types used and repeat visits to specific airports or airlines.
Flighty says its analysis covers commercial passenger services only and excludes cargo, charter and private aviation.
Airline rankings are limited to carriers with at least 150,000 flights recorded by users over the year, a threshold designed to ensure consistency and statistical relevance.
Featured image: Pexels